Logistic Regression: Hypothesis Representation:
Logistic Regression, is, against its own name, a classification model and not a regression model.
As discussed earlier, we want the H to be in range 0 to 1.
Sigmoid function, g(z):
\[G(z) = 1/(1+exp(-z))\]
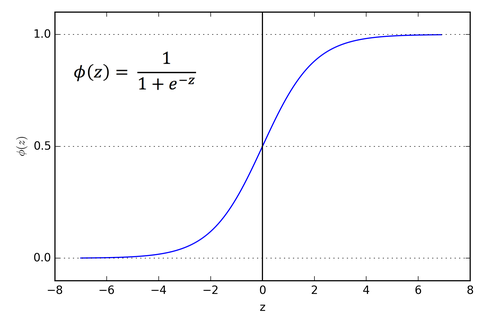
This function is called the sigmoid function. Note that as $exp(-z)$ is always greater than zero, the sigmoid function will always lie between zero and one.
The graph for sigmoid function looks something like this:
This function is called the sigmoid function. Note that as $exp(-z)$ is always greater than zero, the sigmoid function will always lie between zero and one.
The graph for sigmoid function looks something like this:
The Logistic Regression Model:
We define the hypothesis for Logistic Regression as follows: \[H(theta, X) = g(theta.T @ X)\] .
The @ here is the matrix multiplication in python. Some times the sigmoid function is also called as the logistic function.
Interpretation of Hypothesis output:
$H(theta, X)$ is the estimated probability that $y=1$ on input x.
For example, let for x = [[1], [tumorSize]] h evaluates to 0.7. Then we say that patient tumor have 70% chances of being malignant.
Suppose that we predict $y=1$ if $h >= 0.5$ than it is equivalent to say that $theta.T @ X >= 0$ and similarly $theta.T @ X<0.5$ is equivalent to saying $h<0.5$

No comments:
Post a Comment